Option Workbench
To a successful option strategist, an understanding of both historical and implied volatility, as well as their interrelationship, is of crucial importance. Of course, once a trade is put on, whether a simple long position or a complex multi-legged spread, risk management can make or break even the most carefully planned strategy. For options this means knowing the "Greeks" of the position.
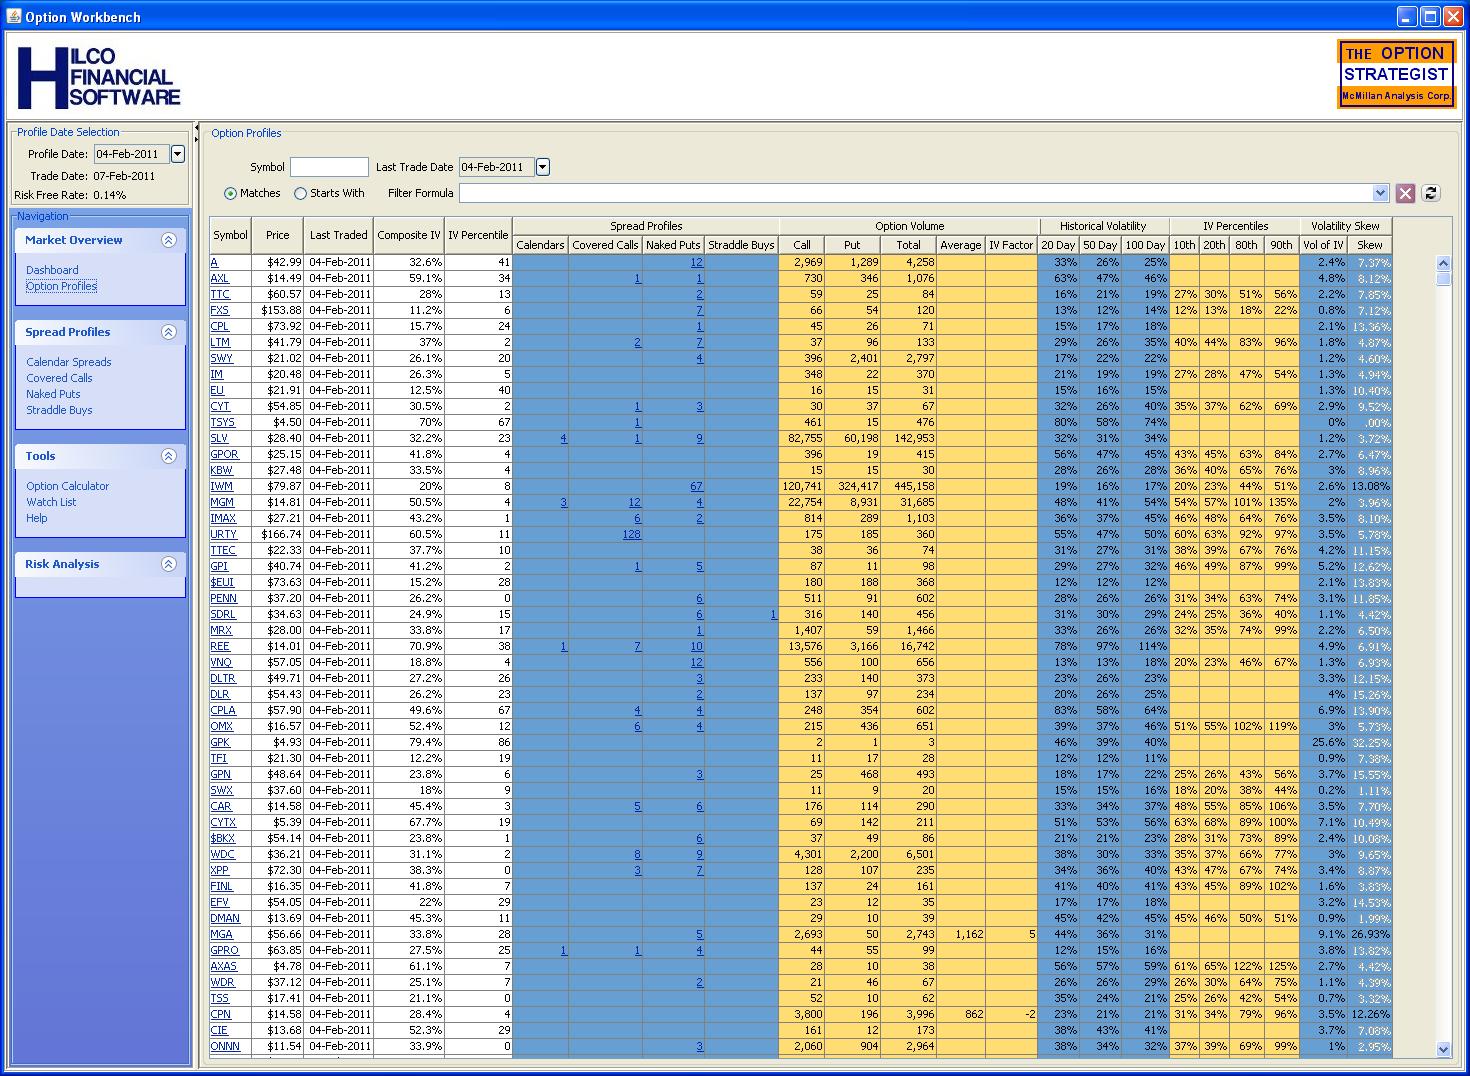
Option Workbench is a quantum leap forward in the analysis of the daily historical volatility, implied volatility extremes and skews, and unusual volume reports available on the Strategy Zone. Option Workbench integrates these data into a single spreadsheet like table that presents a profile of the option market for each stock, index and future covered. The option profile data can be sorted and filtered in various ways to allow a strategist to zero in on trading opportunities.
Once an interesting option profile is identified, Option Workbench provides the tools needed to dig into the details. These tools include:
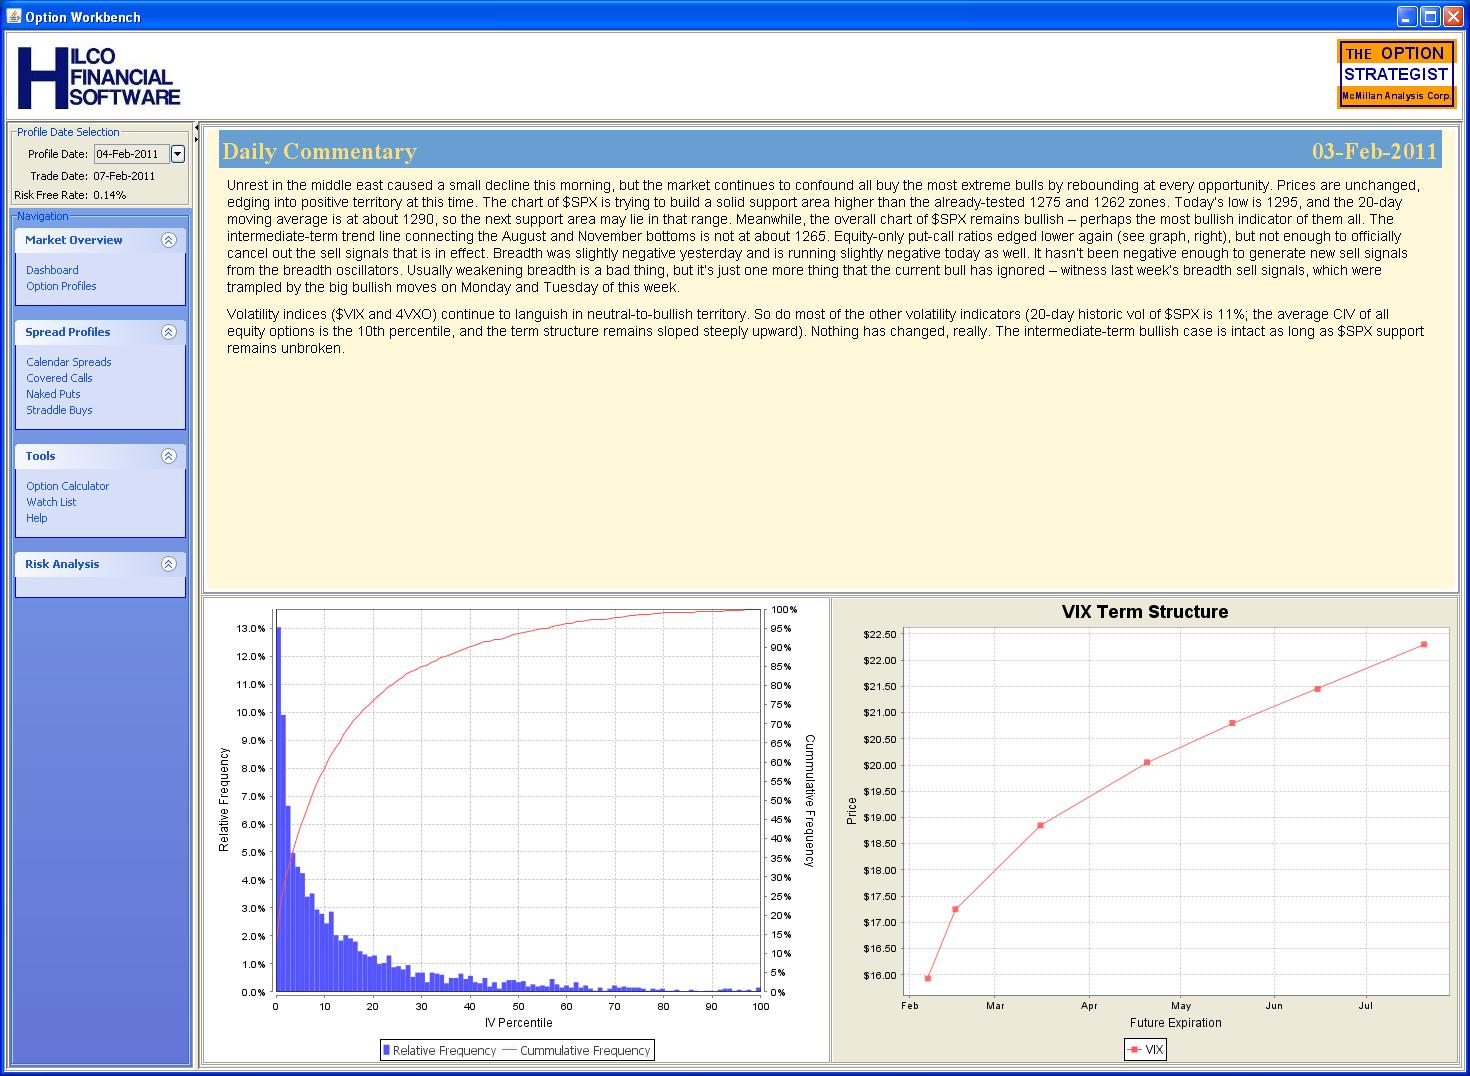
- The Option Workbench Dashboard — The Dashboard has three sections. On the upper half of the Dashboard is the latest market commentary from the Strategy Zone as of the selected profile date. The bottom half of the Dashboard contains two charts. These two charts portray the overall implied volatility environment for the profile date.
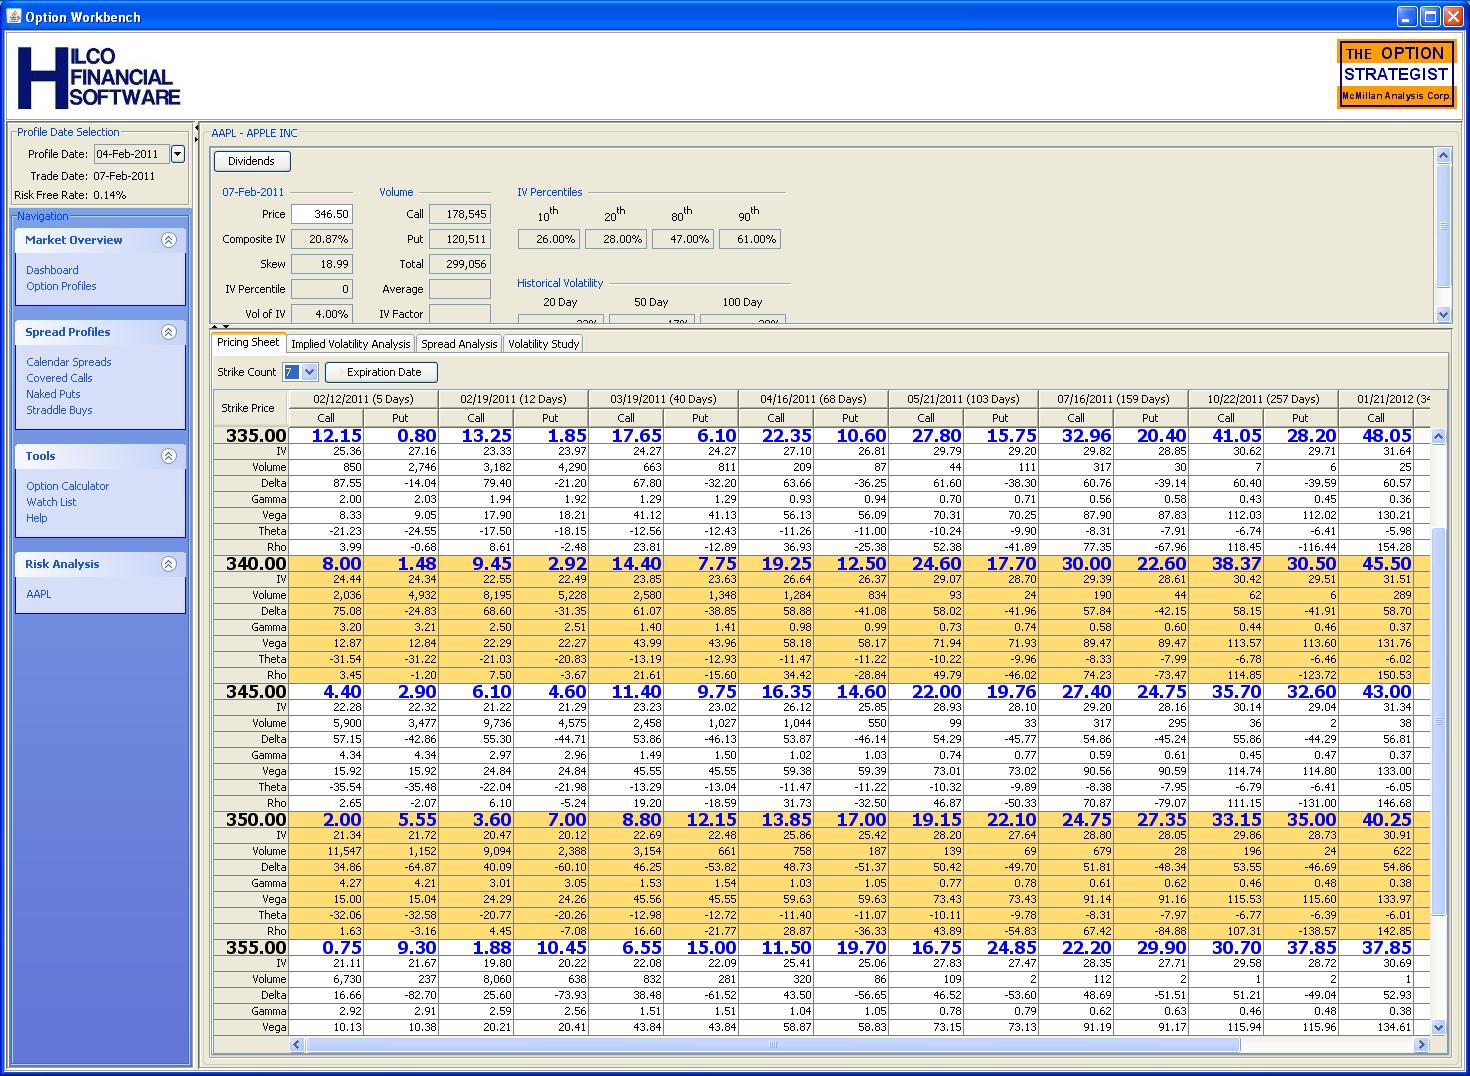
- The Option Pricing Sheet — A tabular view of price, implied volatility, volume, delta, gamma, vega, theta and rho for each call and put. This unique montage, inspired by a similar tool used by floor traders, allows a strategist to easily view and analyze related options.
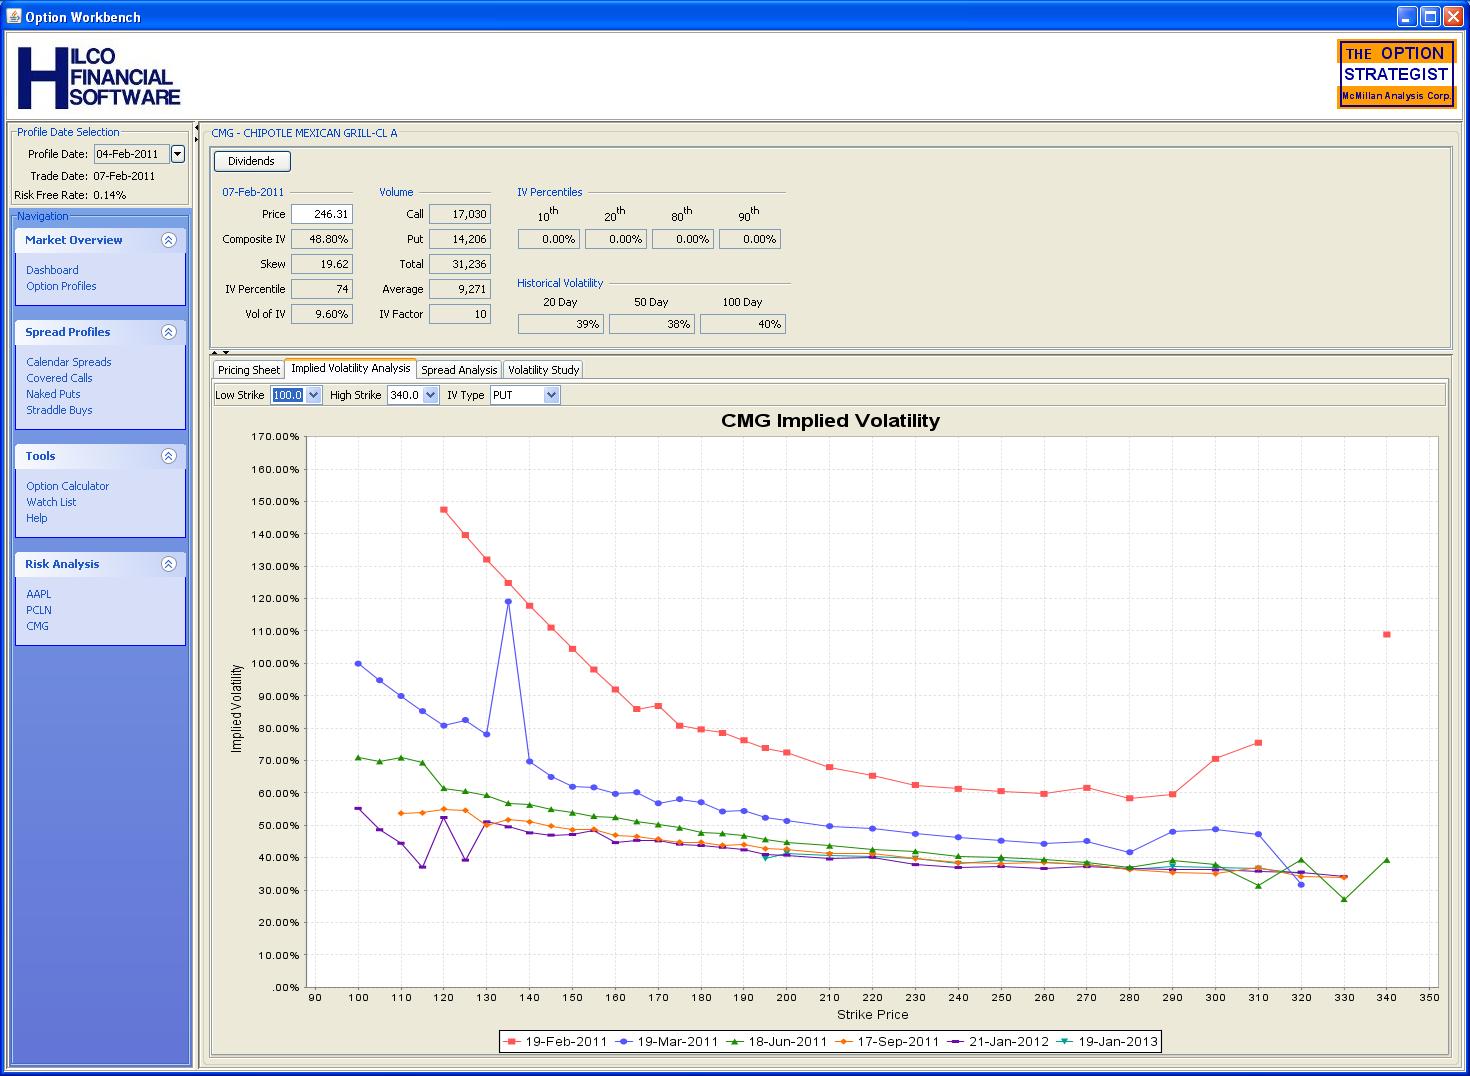
- The Implied Volatility Chart — A graphical view of the implied volatility smile for each expiration date.
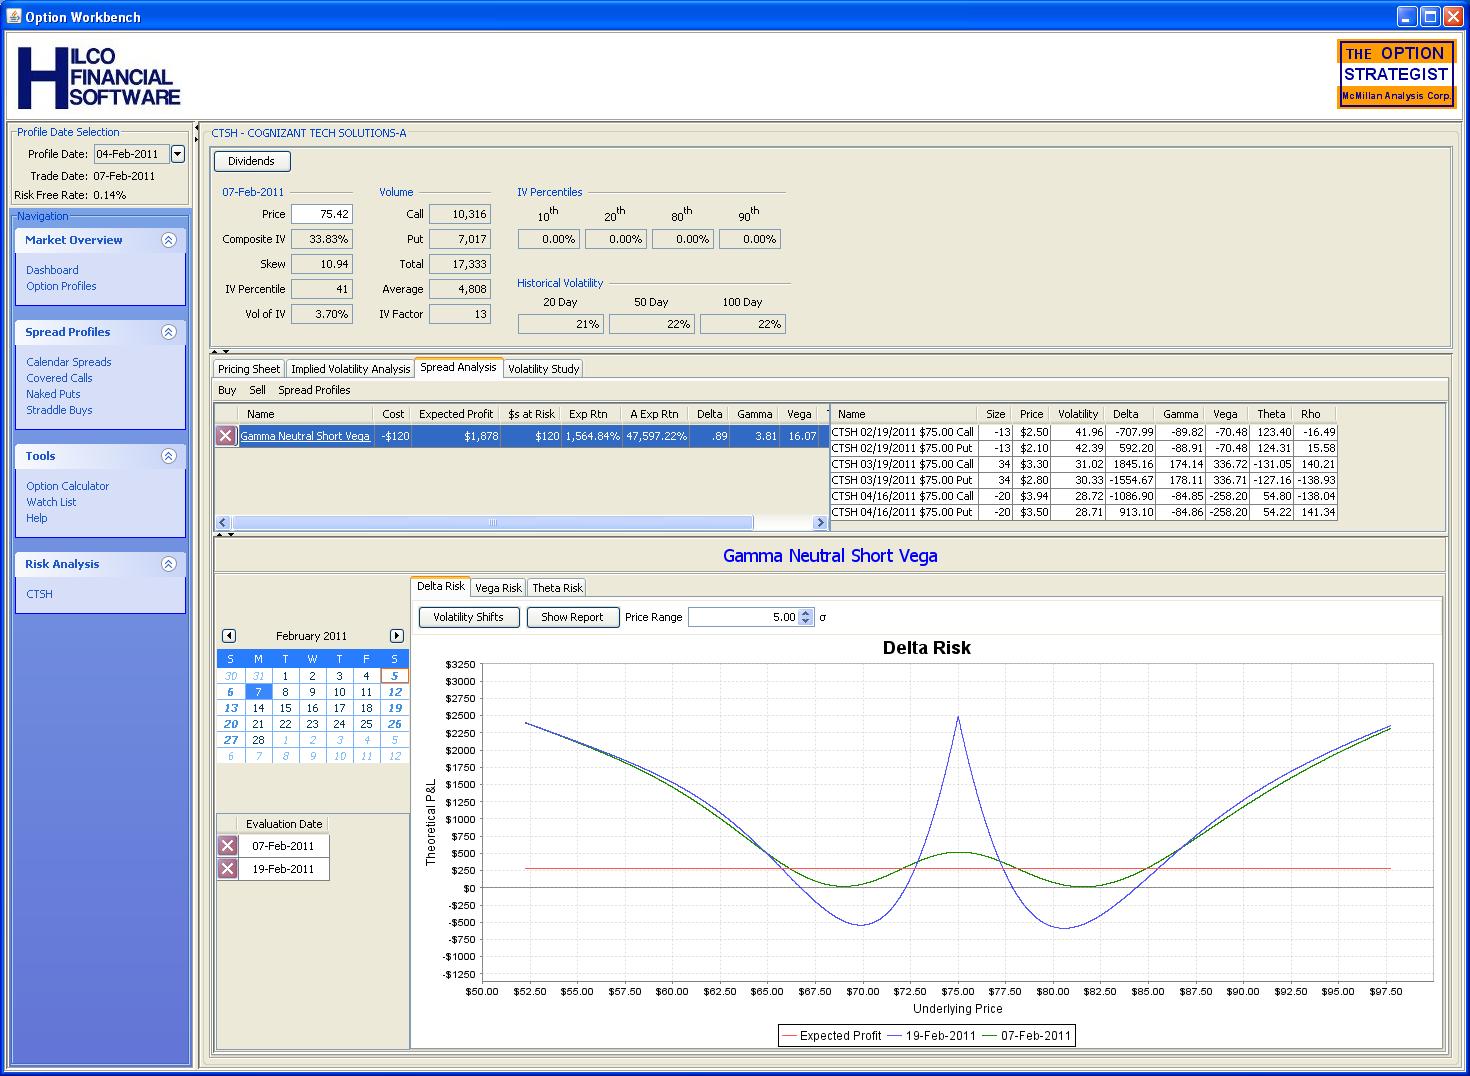
- The Expected Return Calculator — The expected return calculator is the core of the risk analysis capabilities of Option Workbench. This tool allows an option strategist to compare and contrast an unlimited number of potential trades. Additionally, the expected return calculator enables a detailed analysis of the calendar spreads, covered writes, naked puts and straddle buys listed on the Strategy Zone.
-
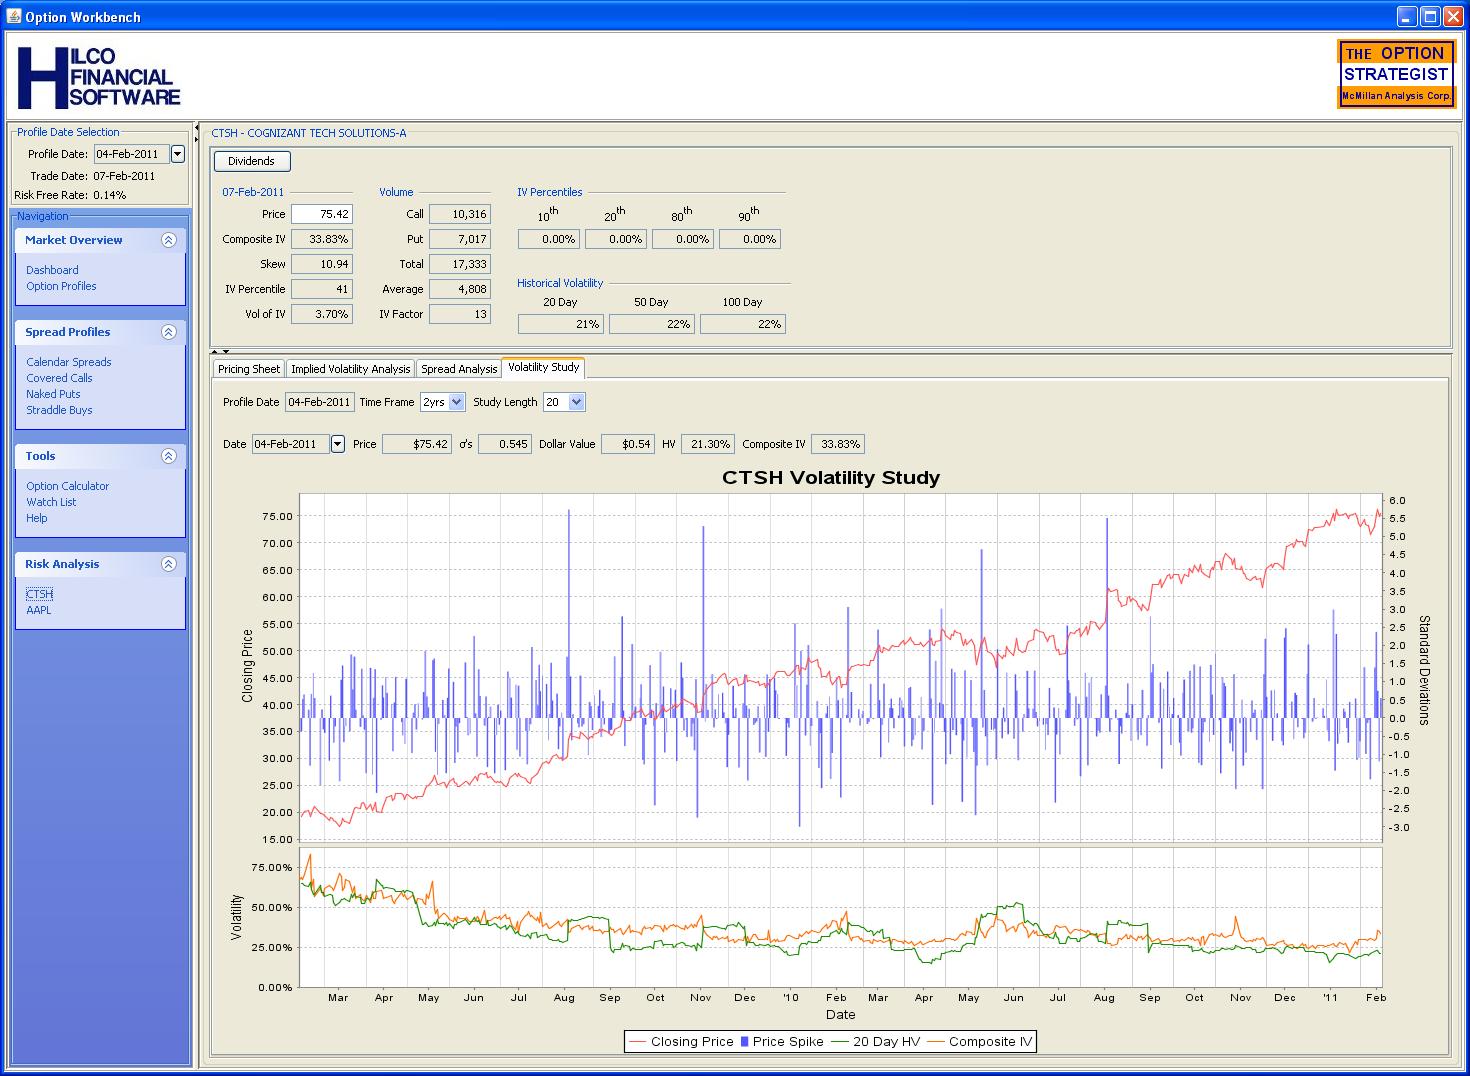
The Volatility Study — The volatility study gives a trader
a unique perspective on closing price movement and volatility. A traditional close price line graph is augmented with
a bar chart that shows how many standard deviations the price changed from the previous close price.
The number of standard deviations is calculated based on the 20, 50 or 100 day historical volatility.
The lower chart shows the history of the currently selected statistical volatility as well as the history of the optoins' composite implied volatility.
Click on the thumbnail to view the full size screen shot

- The Put/Call Ratio Chart — The put/call ratio is simply the number puts that traded on a given day divided by the number of calls that traded on that day. A put/call ratio chart is typically used as sentiment indicator.
- The Spread Neutralizer — The Spread Neutralizer is a tool that is used to create delta/gamma neutral positions in order to take advantage of changing implied volatility due to events, such as earnings announcements.